AI Business Intelligence and Predictive Analytics

AI-powered business intelligence and predictive analytics help organisations transform business data into actionable insights and informed decisions.
AI Business Intelligence and Predictive Analytics: How Businesses Make Smarter Decisions in 2026
Businesses generate information through sales transactions, customer interactions, finance systems, websites, mobile applications, inventory platforms, and daily operations. However, collecting data does not automatically make an organisation data-driven. The real value comes from understanding what the information means, identifying patterns, and using those insights to make better decisions.
AI business intelligence and predictive analytics help organisations move from reviewing historical performance to estimating what may happen next. Business intelligence (BI) turns business information into reports, dashboards, and measurable insights. Predictive analytics uses statistical methods and machine learning to estimate possible future outcomes based on available data.
When combined, these capabilities can help decision-makers understand current performance, identify emerging risks, forecast demand, evaluate opportunities, and plan resources more effectively.
For businesses exploring custom software development, this combination can also provide a foundation for connected reporting systems, intelligent dashboards, and applications that bring operational information into one place.
This guide explains how AI-powered BI and predictive analytics work, where businesses can apply them, what technologies support them, and how to approach implementation.
What Is AI Business Intelligence?
AI business intelligence is the use of artificial intelligence techniques alongside BI tools and data systems to help organisations analyse information, identify patterns, and understand business performance.
Traditional BI commonly relies on reports, dashboards, filters, and predefined metrics. Users review the available information to answer questions such as:
How much revenue did the business generate last month?
Which products performed best?
Which sales region achieved its target?
How much inventory is currently available?
Which operating costs increased?
AI-enhanced BI can extend this process by helping users explore information, identify unusual patterns, generate analytical summaries, and investigate possible reasons behind changes.
For example, a sales dashboard may show that revenue declined during a particular month. An AI-assisted analytical workflow could help examine changes across product categories, customer segments, locations, and sales channels.
The system does not automatically know the business reason for the decline. Its usefulness depends on the quality of the underlying data, the analytical methods used, and the way findings are reviewed.
Traditional BI vs AI-Powered BI
Area | Traditional BI | AI-Powered BI |
|---|---|---|
Reporting | Predefined reports and dashboards | Reports with additional AI-assisted analysis |
Data exploration | Users select filters and dimensions | Users may explore patterns through natural-language or assisted analysis |
Trend analysis | Historical comparisons | Historical analysis with additional pattern detection |
Anomaly detection | Often depends on predefined rules | Can use statistical or machine-learning methods |
Forecasting | May require separate tools or models | Can integrate forecasting and predictive models |
Decision support | Explains measured performance | Can help investigate possible future outcomes |
AI-powered BI does not replace the need for reliable reporting. It adds analytical capabilities to a foundation of well-managed business information.
What Is Predictive Analytics?
Predictive analytics is the process of using historical data, statistical techniques, and machine learning models to estimate future events or outcomes.
Instead of only asking what happened, businesses can investigate questions such as:
How much demand might the business receive next month?
Which customers may be at risk of leaving?
Which products may require replenishment?
Which invoices or transactions may need additional review?
What could happen to sales if demand changes?
Predictive analytics identifies relationships and patterns in available data. A model learns from historical examples and applies those patterns to new information.
Its output is an estimate, not a guarantee. Predictions can become less reliable when business conditions change, historical information is incomplete, or the model is used outside the conditions for which it was developed.
How Predictive Analytics Works
A typical predictive analytics process includes several stages:
Define the business question: Identify the outcome the organisation wants to estimate, such as customer churn, demand, or payment delays.
Collect relevant data: Gather historical records from business systems and other appropriate sources.
Prepare the information: Correct errors, handle missing values, standardise formats, and select relevant variables.
Choose an analytical method: Select an appropriate statistical or machine-learning technique.
Train the model: Use historical examples to identify patterns associated with the target outcome.
Evaluate performance: Test the model using data that was not used to train it.
Generate predictions: Apply the evaluated model to new or current information.
Monitor and improve: Compare predictions with actual outcomes and review performance over time.
The process should be designed around a specific business decision. A technically sophisticated model is not necessarily valuable if its predictions do not help the organisation take an appropriate action.
Business Intelligence and Predictive Analytics: How They Work Together
Business intelligence and predictive analytics are closely related, but they answer different questions.
BI helps explain business performance through reporting and analysis. Predictive analytics estimates possible future outcomes. Combining them creates a more complete view of business operations.
Consider a retail business that wants to manage product availability.
Its BI dashboard may show:
Current stock levels.
Previous sales volumes.
Revenue by product.
Supplier delivery performance.
Seasonal sales patterns.
A predictive model can use relevant historical information to estimate future demand. The business can then compare expected demand with available stock and supplier lead times.
This creates a connected decision-making process:
Business data → Data preparation → BI reporting → Predictive modelling → Decision support → Business action
For example, if a product is expected to experience higher demand, the system may highlight the forecast and allow an inventory manager to review replenishment options.
The prediction should still be checked against relevant factors such as supplier availability, budget, storage capacity, and current market conditions.
Descriptive, Diagnostic, Predictive, and Prescriptive Analytics
These four analytical approaches support different stages of business decision-making.
Analytics type | Main question | Example |
|---|---|---|
Descriptive | What happened? | Monthly sales report |
Diagnostic | Why did it happen? | Analysis of a revenue decline |
Predictive | What may happen? | Forecast of next month's sales |
Prescriptive | What action should be considered? | Comparing inventory replenishment options |
Prescriptive analytics can incorporate business rules, optimisation methods, and predictive outputs to evaluate possible actions. It should not be confused with a guarantee that a recommended action will produce a particular result.
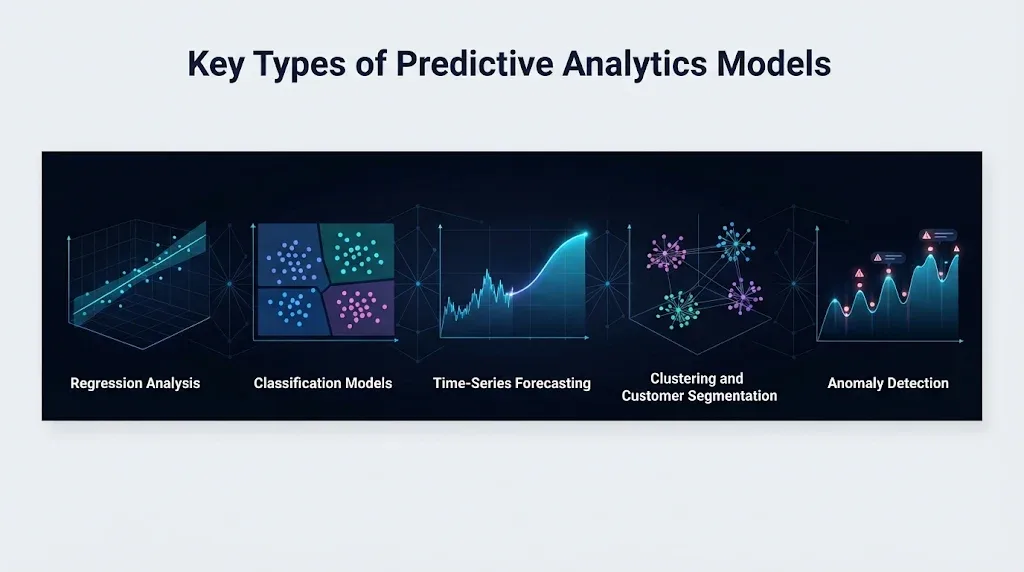
Key Types of Predictive Analytics Models
Different business questions require different analytical methods. Selecting a model depends on the available data, the target outcome, the level of accuracy required, and how the result will be used.
1. Regression Analysis
Regression models estimate relationships between variables and predict numerical outcomes.
Businesses can use regression for scenarios such as:
Estimating sales revenue.
Forecasting operating expenses.
Understanding factors associated with customer spending.
Estimating delivery times.
Analysing relationships between pricing and demand.
For example, a company may use historical sales, product prices, and seasonal information to estimate future revenue.
2. Classification Models
Classification models assign records to categories based on learned patterns.
Possible applications include:
Identifying customers with a higher churn risk.
Categorising transactions for additional review.
Classifying leads by potential sales priority.
Identifying applications that require manual assessment.
A classification result should be interpreted using its confidence, evaluation results, and the consequences of an incorrect classification.
3. Time-Series Forecasting
Time-series forecasting uses observations collected over time to estimate future values.
It is useful when businesses maintain regular historical measurements, such as daily sales, monthly revenue, inventory movements, or website traffic.
A forecasting system may consider:
Historical trends.
Seasonal patterns.
Repeated demand cycles.
Recent changes.
Relevant external variables.
For example, a distributor may compare previous monthly orders with current demand indicators to estimate future stock requirements.
4. Clustering and Customer Segmentation
Clustering groups records based on similarities in their characteristics.
Businesses may use it to explore customer segments, purchasing behaviour, product relationships, or operational patterns.
Unlike classification, clustering does not necessarily require predefined categories. The groups are identified from the structure of the data and must be interpreted in their business context.
5. Anomaly Detection
Anomaly detection identifies observations that differ from expected patterns.
Examples include:
Unusual transaction values.
Unexpected inventory movements.
Sudden changes in website activity.
Irregular operating expenses.
Unusual patterns in equipment performance.
An anomaly is not automatically proof of fraud, failure, or an error. It is a signal that may require further investigation.
Practical Business Applications of AI Business Intelligence and Predictive Analytics
The value of analytics becomes clearer when connected to real business processes. Different industries can use these capabilities to address specific operational and strategic questions.
1. Sales Forecasting and Revenue Planning
Sales teams can combine historical transactions, product performance, customer activity, and seasonal trends to estimate future revenue.
A BI dashboard may display:
Sales by region.
Revenue by product.
Monthly target achievement.
Sales pipeline status.
Average transaction value.
Predictive models can add estimates of future sales performance or identify opportunities that require attention.
For example, a company may notice that sales of a particular product category have increased during previous seasonal periods. A forecasting model can use the historical pattern to estimate possible demand for the next period.
Managers can use the estimate as one input when planning inventory, staffing, and marketing activity.
2. Customer Behaviour and Churn Prediction
Customer data can help businesses understand purchasing patterns, engagement, service usage, and customer retention.
Predictive analytics may identify customer groups whose behaviour resembles patterns associated with previous customer departures.
Potential indicators include:
Reduced purchase frequency.
Longer gaps between transactions.
Lower engagement with digital services.
Increased support requests.
Changes in subscription usage.
A business can use these insights to review customer experience and consider appropriate retention activities.
Predictions should be handled responsibly. A customer should not be treated unfairly simply because a model assigns a risk score.
3. Inventory and Supply Chain Management
Inventory planning often requires balancing customer demand, storage capacity, supplier lead times, and purchasing costs.
BI systems can show current inventory levels, product movement, stock shortages, and supplier performance.
Predictive analytics can estimate future demand and help identify products that may require replenishment.
For example, a distributor can combine previous orders, current stock, and supplier delivery history to support purchasing decisions.
The resulting recommendations should account for business constraints such as minimum order quantities, available cash, storage limits, and changing supplier conditions.
4. Financial Planning and Cash Flow Analysis
Finance teams can use BI dashboards to monitor revenue, expenditure, receivables, payables, and budget performance.
Predictive methods may help estimate:
Expected cash inflows.
Future operating expenses.
Potential payment delays.
Budget variances.
Revenue scenarios.
A finance dashboard can compare planned and actual expenditure, while forecasting models help evaluate possible future cash positions.
These estimates can support financial planning, but they should not replace professional financial review or established approval procedures.
5. Marketing Performance and Campaign Analysis
Marketing teams generate data from websites, advertising platforms, email campaigns, social channels, and customer relationship systems.
BI can consolidate campaign results and show metrics such as:
Website traffic.
Lead generation.
Conversion rates.
Campaign expenditure.
Customer acquisition trends.
Predictive analytics can help estimate which customer segments may respond to particular campaigns or identify patterns associated with conversion.
Businesses should evaluate these models using actual campaign results rather than assuming that historical relationships will continue unchanged.
6. Human Resources and Workforce Planning
Organisations can use analytics to understand recruitment, attendance, workforce distribution, training activity, and employee turnover patterns.
Potential applications include:
Workforce demand planning.
Recruitment pipeline reporting.
Training needs analysis.
Employee retention analysis.
Attendance trend monitoring.
HR analytics requires particular care because employee information is sensitive. Access should be limited to authorised users, and automated predictions should not become the sole basis for important employment decisions.
7. Operational Performance and Predictive Maintenance
Manufacturing, facilities, logistics, and service organisations can use operational data to monitor performance.
BI dashboards may track equipment utilisation, maintenance records, downtime, service response times, and operational costs.
Predictive maintenance models can analyse relevant sensor readings and historical maintenance information to estimate when equipment may require inspection.
Such estimates can help maintenance teams prioritise checks. They do not eliminate the need for safety procedures, professional inspections, or manufacturer guidance.
AI Business Intelligence for Businesses in Qatar
Businesses operating in Qatar may manage information across finance, sales, procurement, customer service, logistics, human resources, and digital channels.
A connected analytics environment can help bring these information sources together and give authorised decision-makers a clearer view of operations.
Potential applications vary by industry.
Industry | BI application | Predictive analytics opportunity |
|---|---|---|
Retail and e-commerce | Sales and product dashboards | Demand forecasting |
Real estate | Property sales and occupancy reporting | Market and occupancy trend estimation |
Logistics | Delivery and fleet performance reporting | Delivery demand and maintenance estimates |
Healthcare administration | Appointment and operational reporting | Appointment demand forecasting |
Finance | Revenue and expense monitoring | Cash flow and transaction risk analysis |
Education | Enrolment and attendance reporting | Student demand and resource planning |
Hospitality | Booking and revenue dashboards | Occupancy and demand forecasting |
These are potential applications rather than claims about specific deployments.
Qatar-Specific Planning Considerations
Organisations planning analytics systems in Qatar should consider:
Data protection: Review applicable privacy requirements and establish appropriate controls for collecting, processing, storing, and sharing personal information.
Data access: Define which employees and departments can view financial, customer, workforce, and operational information.
System integration: Consider how the analytics environment will connect with existing ERP, CRM, accounting, e-commerce, and operational applications.
Business language and reporting: Determine whether users need English, Arabic, or bilingual interfaces and reporting formats.
Infrastructure: Assess hosting, availability, backup, security, and data-location requirements before selecting a deployment approach.
Qatar's technology sector also includes growing activity around AI, cloud computing, and data analytics. Invest Qatar identifies AI and data analytics among the areas relevant to the country's technology ecosystem. Businesses can review its technology investment information for broader context.
Essential Features of an AI Business Intelligence Platform
A useful BI and predictive analytics platform should support the complete journey from data collection to business action.
1. Data Integration
The platform should connect to relevant information sources, which may include:
ERP and CRM systems.
Accounting software.
Websites and mobile applications.
Databases and spreadsheets.
E-commerce platforms.
Operational systems and APIs.
Integration helps reduce isolated reporting environments and supports more consistent analysis.
2. Data Cleaning and Transformation
Information from different systems may use inconsistent formats, duplicate records, incomplete fields, or different naming conventions.
Data preparation processes help standardise and transform this information before analysis.
3. Interactive Dashboards
Dashboards should present important business indicators in a clear and accessible format.
Useful capabilities may include:
Filters and drill-down analysis.
Trend charts.
KPI monitoring.
Role-based dashboard views.
Scheduled report updates.
Export and sharing controls.
Microsoft's Power BI documentation provides guidance on connecting data, creating reports, sharing dashboards, and developing analytical solutions.
4. Predictive Modelling
The platform may include forecasting, classification, regression, clustering, or anomaly detection capabilities, depending on the business requirements.
Not every organisation needs every model type. The system should prioritise the analytical tasks that support defined business decisions.
5. Alerts and Notifications
Alerts can notify authorised users when a metric crosses a defined threshold or a model identifies a pattern that requires review.
For example, a system may notify an inventory manager when stock falls below a configured level.
6. Security and Access Management
Business analytics platforms can contain sensitive commercial and personal information.
Important controls include:
Role-based permissions.
Secure authentication.
Encryption where appropriate.
Audit logging.
Data retention policies.
Backup and recovery procedures.
Controlled report sharing.
7. Integration with Business Applications
Analytics becomes more useful when insights can be accessed within existing workflows.
For example, a web application may display sales forecasts alongside customer records, while an internal management system may show inventory alerts to authorised staff.
Businesses considering connected dashboards and management interfaces can explore web application development services.
Technologies Behind AI Business Intelligence and Predictive Analytics
A modern analytics environment usually combines several technology layers rather than relying on a single product.
Data Sources and Integration
Business applications, databases, spreadsheets, APIs, and connected devices can provide the information required for analysis.
Integration methods may include scheduled imports, API connections, event-based processing, and data pipelines.
Data Warehouses and Data Platforms
A data warehouse or analytical data platform can consolidate information from multiple systems into a structure designed for reporting and analysis.
The design should consider data volume, query performance, refresh requirements, access control, and future growth.
Google Cloud's data analytics documentation explains its analytics services and related data-platform capabilities. Its BigQuery overview also describes analytical workloads and integrations with BI tools.
Business Intelligence Tools
BI tools help users explore information and create reports and dashboards.
Examples include:
Microsoft Power BI.
Google Looker.
Tableau.
Custom-built analytics dashboards.
The right choice depends on the organisation's existing systems, user skills, budget, governance needs, and reporting requirements.
Machine Learning Frameworks
Predictive models can be developed using statistical and machine-learning libraries and platforms.
The choice depends on the task, technical team, deployment environment, and model maintenance requirements.
AWS describes common machine-learning applications such as demand forecasting, customer churn prediction, anomaly detection, and predictive maintenance in its Machine Learning Lens guidance.
APIs and Custom Applications
APIs can connect analytical services with internal software, websites, and mobile applications.
For example, a business application may request a forecast from a model service and display the result in a dashboard.
This architecture can help organisations use analytical insights within their existing business processes.
How to Implement AI Business Intelligence and Predictive Analytics
A successful implementation starts with business requirements, not with selecting an AI tool.
Step 1: Identify the Business Problem
Define the decision the organisation wants to improve.
Examples include:
Improving sales forecasting.
Reducing inventory shortages.
Understanding customer churn.
Monitoring operating expenses.
Improving equipment maintenance planning.
Choose a focused problem that can be measured.
Step 2: Review Existing Data Sources
Identify where the required information currently resides.
Review:
Data availability.
Data quality.
Duplicate records.
Missing information.
System ownership.
Access permissions.
Historical coverage.
If the organisation cannot access reliable historical information, it may need to improve its data collection processes before building predictive models.
Step 3: Define KPIs and Success Measures
Select measurable indicators that connect the analytics project with business outcomes.
For example, an inventory forecasting project might monitor forecast error, stockout frequency, excess inventory, and replenishment performance.
A customer retention project may monitor churn identification quality and the outcomes of retention activities.
Step 4: Design the Data Architecture
Plan how information will move from source systems into the analytics environment.
A typical architecture may include:
Business applications and databases.
Data integration pipelines.
Data storage or warehouse.
Data cleaning and transformation.
BI semantic models and reporting.
Predictive model services.
Dashboards, alerts, and business applications.
Microsoft provides an overview of BI architecture in its business intelligence solution architecture guidance.
Step 5: Build the BI Foundation
Start with reliable reporting.
Create dashboards for the selected business area, define consistent KPI calculations, and confirm that users understand the information being presented.
This establishes a foundation for more advanced analytics.
Step 6: Develop and Evaluate Predictive Models
Select a model that matches the business question.
Use appropriate historical data, separate training and evaluation data, and compare model predictions with actual outcomes.
Evaluation should consider more than a single accuracy score. For example, a churn model may need to balance identifying at-risk customers with avoiding excessive false alerts.
Step 7: Integrate Insights into Workflows
Make the outputs available where decisions happen.
This may involve dashboards, notifications, CRM records, inventory systems, or custom web applications.
Human review should remain part of workflows where predictions could affect customers, employees, finances, or safety.
Step 8: Monitor and Improve
After deployment, monitor data quality, model performance, user adoption, and business outcomes.
Models may become less reliable when customer behaviour, market conditions, products, or operating processes change.
A regular review process helps determine when a model should be recalibrated, retrained, or replaced.
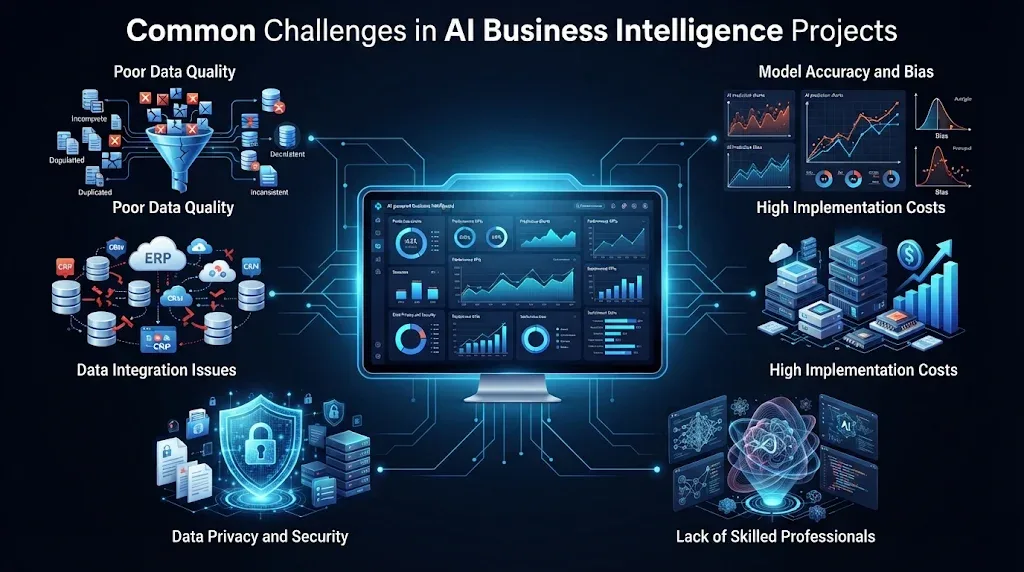
Common Challenges in AI Business Intelligence Projects
Analytics projects can face technical, organisational, and data-related challenges.
Poor Data Quality
Inconsistent or incomplete information can produce misleading reports and unreliable predictions.
Practical response: Establish data ownership, validation rules, standard formats, and regular quality checks.
Disconnected Business Systems
When departments use separate applications, information may be duplicated or difficult to compare.
Practical response: Identify priority integrations and develop a consistent data model.
Unclear Business Objectives
A project can become an expensive technical exercise if it does not solve a defined business problem.
Practical response: Start with measurable decisions and involve the people who will use the results.
Model Bias and Unreliable Predictions
Historical information may reflect past limitations or changing conditions. A model can also perform well during testing but poorly in real operations.
Practical response: Use appropriate evaluation methods, monitor results, document limitations, and provide human review where needed.
Security and Privacy Risks
Analytics environments may consolidate information that was previously stored across separate systems.
Practical response: Apply access controls, data minimisation, secure integration, audit logging, and appropriate retention policies.
Low User Adoption
A technically capable dashboard may not be useful if it is difficult to understand or does not fit existing workflows.
Practical response: Involve business users during design, provide training, and prioritise clear, relevant reporting.
How Much Does AI Business Intelligence and Predictive Analytics Cost?
There is no single fixed price for implementing an AI-powered analytics platform. Costs depend on the complexity of the business requirements, data environment, integrations, infrastructure, and ongoing support.
Important cost factors include:
Cost factor | What affects the cost |
|---|---|
Data integration | Number and complexity of connected systems |
Data preparation | Data volume, quality, and transformation requirements |
BI dashboards | Number of reports, users, and interactive features |
Predictive models | Model complexity, data requirements, and evaluation |
Infrastructure | Hosting, storage, processing, and licensing |
Security | Access management, monitoring, and compliance requirements |
Maintenance | Support, model monitoring, updates, and improvements |
A smaller project may begin with a few dashboards and a focused forecasting requirement. A larger organisation may need a central data platform, multiple integrations, advanced machine-learning services, and role-specific reporting.
Businesses should request a scope-based estimate rather than relying on a generic price. The estimate should explain implementation stages, recurring platform expenses, maintenance responsibilities, and any third-party licensing or usage charges.
How to Measure the Success of an Analytics Platform
A successful implementation should improve a business process or decision, not simply produce more charts.
Possible performance measures include:
Forecast error: How closely predictions match actual outcomes.
Reporting time: How long teams spend preparing and distributing reports.
Data quality: The completeness, consistency, and accuracy of important records.
Decision turnaround: How quickly users can access relevant information.
Inventory performance: Changes in stock availability and excess inventory.
Customer retention: Changes in retention outcomes after relevant actions.
User adoption: Whether intended employees regularly use the platform.
Operational efficiency: Whether the system helps reduce avoidable manual work.
The right measures depend on the original business objective. A project should establish a baseline before implementation so that later results can be compared fairly.
Future Trends in AI Business Intelligence and Predictive Analytics
Analytics technology continues to evolve. Several developments may influence how organisations work with business data.
Natural-Language Analytics
Users increasingly expect to ask questions in ordinary language rather than writing queries or navigating complex reports.
Natural-language interfaces can make data exploration more accessible, but the system still needs reliable data models, clear definitions, and permission controls.
Real-Time Business Intelligence
Some decisions depend on information that changes continuously.
Streaming and near-real-time analytics can help organisations monitor transactions, operational events, equipment activity, and customer interactions.
Not every business needs real-time processing. The appropriate update frequency depends on the value of receiving information quickly.
AI-Assisted Reporting
AI features can help users generate summaries, explore trends, and investigate data.
Microsoft's Power BI reporting guidance describes reporting capabilities, including AI-assisted report experiences. Organisations should review generated explanations before using them in important decisions.
Predictive and Prescriptive Decision Support
Businesses may increasingly combine forecasts with scenario analysis and optimisation methods.
For example, an inventory planning system could compare possible replenishment quantities under different demand assumptions.
Such recommendations should remain transparent and subject to business constraints.
More Connected Business Applications
BI and predictive models can become part of the applications employees already use.
Instead of opening separate analytics tools, authorised users may see relevant insights inside CRM, ERP, finance, or operational dashboards.
This makes integration and application design important parts of an analytics strategy.
Choosing the Right AI Business Intelligence Development Partner
Businesses evaluating an analytics development partner should look beyond attractive dashboards or claims about AI capabilities.
Consider the following questions:
Business understanding: Can the provider translate operational requirements into measurable analytics objectives?
Data integration: Can it connect the relevant business systems and manage data consistently?
Technical capability: Does it understand databases, APIs, data pipelines, BI tools, and machine learning?
Security: Can it explain access control, data protection, monitoring, and deployment practices?
Scalability: Can the solution support additional users, data sources, and analytical requirements?
Usability: Will managers and employees be able to understand and use the dashboards?
Ongoing support: Is there a clear plan for maintenance, model monitoring, and future improvements?
A good partner should be able to explain the architecture, limitations, implementation stages, and expected business measures without promising guaranteed predictive accuracy or financial results.
How Galaxium Coding Can Support Data-Driven Business Solutions
An effective analytics environment often requires more than a dashboard. Businesses may need connected databases, custom applications, API integrations, automated workflows, and secure cloud infrastructure.
Galaxium Coding is a Qatar-based technology company offering software and digital solution development. Depending on project requirements, businesses can explore its software development services for custom business systems and applications.
A connected solution may involve:
Custom dashboards for business reporting.
Web applications for accessing operational insights.
API integrations between existing business systems.
Data-driven management interfaces.
Cloud and infrastructure components.
Application features that present predictive outputs.
For organisations comparing implementation approaches, the Galaxium Coding projects and portfolio can provide a starting point for reviewing its published work.
The appropriate architecture depends on the organisation's data, objectives, security requirements, and existing technology environment.
Final Thoughts
AI business intelligence and predictive analytics can help organisations make better use of the information they already collect. BI provides visibility into business performance, while predictive analytics estimates possible future outcomes.
Together, they can support sales planning, customer analysis, inventory management, financial forecasting, workforce planning, and operational improvement.
The most effective approach is to begin with a clear business problem, establish reliable data, build useful reporting, and introduce predictive models where they provide measurable value. Security, governance, model evaluation, and ongoing monitoring should remain part of the implementation.
Businesses planning connected dashboards, intelligent applications, or data-driven software can contact Galaxium Coding to discuss their requirements and explore an appropriate development approach.
Frequently Asked Questions
1. What is AI business intelligence?
AI business intelligence combines traditional business intelligence with AI-assisted analysis to help organisations explore data, identify patterns, generate insights, and understand business performance.
2. What is predictive analytics in business?
Predictive analytics uses historical data, statistical techniques, and machine learning to estimate possible future outcomes, such as sales demand, customer churn, inventory requirements, or payment delays.
3. What is the difference between business intelligence and predictive analytics?
Business intelligence primarily helps businesses understand and analyse current or historical performance. Predictive analytics uses available data to estimate what may happen in the future. They can be combined within one analytics environment.
4. Can small businesses use predictive analytics?
Yes. Small businesses can start with focused applications such as sales forecasting, customer segmentation, inventory planning, or expense analysis. The solution should match their data availability, budget, and operational needs.
5. Which tools are used for AI business intelligence?
Tools vary by requirement. Common options include Microsoft Power BI, Google Looker, Tableau, cloud data platforms, databases, and machine-learning frameworks. Some organisations also use custom-built dashboards and analytics applications.
6. How does predictive analytics help sales teams?
It can help sales teams estimate future revenue, identify customer patterns, analyse pipeline activity, and prioritise opportunities. Predictions should be evaluated against actual sales results.
7. Is predictive analytics the same as artificial intelligence?
No. Predictive analytics is an analytical approach that can use statistical methods and machine learning. Artificial intelligence is a broader field that includes additional capabilities such as language processing, computer vision, and generative AI.
8. Does predictive analytics guarantee accurate forecasts?
No. Forecasts are estimates based on available information and model assumptions. Data quality, changing conditions, and model limitations can affect their reliability.
9. How can businesses in Qatar benefit from AI-powered BI?
Businesses in Qatar can explore AI-powered BI for sales reporting, financial planning, inventory management, customer analysis, workforce reporting, and operational monitoring. The most suitable applications depend on each organisation's industry, systems, and data requirements.
10. How long does it take to implement a BI and predictive analytics solution?
The timeline depends on the number of data sources, quality of existing information, dashboard requirements, model complexity, integrations, and testing needs. A focused reporting project may be simpler than a multi-department predictive analytics platform.
11. Does a business need a data warehouse for predictive analytics?
Not every project requires a dedicated data warehouse. Smaller solutions may use existing databases or other suitable data sources. A warehouse or central data platform can become useful when an organisation needs to combine information from multiple systems at scale.
12. How should a business start an AI analytics project?
Start by identifying one important business decision, reviewing the available data, defining measurable KPIs, and building a reliable reporting foundation. Add predictive modelling when the data and business case support it.


